04.30.2009 10:08
Updating ubuntu stuck on a LTS release
I have several machines that passed
through the 8.04 long term support (LTS) release. When in an LTS
release version, Ubuntu does not want to update itself:
% sudo do-release-upgrade
Checking for a new ubuntu release
No new release found
The trick is to set the Prompt from lts to normal:
% sudo perl -pi -e 's|Prompt=lts|Prompt=normal|' /etc/update-manager/release-upgradesThen you can go through the normal upgrade process:
% sudo apt-get install update-manager-core
% sudo do-release-upgrade
It is interesting to see that the do-release-upgrade is a python script. It takes a '-h' flag for help. One option that it needs is to just answer y or the default to all questions for a fully automated upgrade.
% do-release-upgrade -h
Usage: do-release-upgrade [options]

Options:
  -h, --help            show this help message and exit
  -d, --devel-release   Check if upgrading to the latest devel release is
                        possible
  -p, --proposed        Try upgrading to the latest release using the upgrader
                        from $distro-proposed
  -m MODE, --mode=MODE  Run in a special upgrade mode. Currently 'desktop' for
                        regular upgrades of a desktop system and 'server' for
                        server systems are supported.
  -f FRONTEND, --frontend=FRONTEND
                        Run the specified frontend
  -s, --sandbox         Test upgrade with a sandbox aufs overlay
04.28.2009 18:49
CCOM training - fire fighting
I am bummed I wasn't there to see
this... Today, the students in the CCOM Seamanship class got to
practice fire fighting. I always enjoy when the science crew on
ships is required to practice with the fire hoses. The training is
important and it's fun too!
Fire Safety Training [The Moni-blog]

Fire Safety Training [The Moni-blog]
04.28.2009 14:27
NOAA tides via SMS
Janice just asked me if NOAA tides
are available via mobile text messages. It appears that they are
not offering a text message service. This looks like a fun project,
but not something I have time for. I also don't know how you would
specify where you are looking for tides. The NOAA station codes are
not easy to remember. I suppose that you could use a geocoding
library to guess the nearest station based on a spelled out city,
state. That would mostly work. Should be fairly easy to write the
SMS bridge as there are libraries to interface with AIM via the
OSCAR protocol and that already handles conversations with mobile
numbers.
In other news, a friend reports that JPL has blocked Live Journal. I know that JPL thinks it is helping to reduce drains on productivity, but when organizations block these kinds of tools, they are likely causing themselves harm. I've seen first hand that Live Journal made my most recent work at JPL much more enjoyable. When you work all hours, anything that keeps you connected to people is a very good thing. I urge JPL to think about how to work with the technology to get an overall boost in how well enjoy being a part of the community and general productivity. What's next? Will it be blocking YahooMail/GMail/Hotmail/Facebook or even slashdot? I've had places I work block IRC because "people only use IRC for Warez and botnets." That blocked me from talking to other opensource software developers while at work... definitely not good for my productivity.
In other news, a friend reports that JPL has blocked Live Journal. I know that JPL thinks it is helping to reduce drains on productivity, but when organizations block these kinds of tools, they are likely causing themselves harm. I've seen first hand that Live Journal made my most recent work at JPL much more enjoyable. When you work all hours, anything that keeps you connected to people is a very good thing. I urge JPL to think about how to work with the technology to get an overall boost in how well enjoy being a part of the community and general productivity. What's next? Will it be blocking YahooMail/GMail/Hotmail/Facebook or even slashdot? I've had places I work block IRC because "people only use IRC for Warez and botnets." That blocked me from talking to other opensource software developers while at work... definitely not good for my productivity.
04.27.2009 17:01
Google Lat Long Blog
Update Apr-28:
Two Collections: US Coast Guard and Right Whales [Google Earth
Blog] - note that the database I am using only covers the North
East area of the United States.
Update Apr-27: Monica posted on her blog about this visualization: Right Whales and Healy Now in Google Earth
Thanks to Steve Miller for his post on the Google Lat Long Blog: Right whales, right there

Update Apr-27: Monica posted on her blog about this visualization: Right Whales and Healy Now in Google Earth
Thanks to Steve Miller for his post on the Google Lat Long Blog: Right whales, right there
04.27.2009 07:20
Andy Norris on AIS Binary Messages
The May
09 Digital Ship has an article from Andy Norris about AIS and
it's potential. In the article, he worries about viruses causing
trouble over the pilot port:
Next, I forget which signal type runs on a pilot port (RS-232, 422, 488), but just provide the computer with the listening lines. Any device so connected can hear all of the NMEA scentences, but can not cause trouble. Or someone can grab a small embedded computer and write some quick NMEA filtering code. Then route the connection through the two serial ports. This is the same idea as firewalls for computers.
Finally, I have to remind vendors and authorities that produce software - there are more secure platforms than Windows. OpenBSD is probably the most secure operating system generally available. If that is too unusual for you, consider Linux with tools like App Armor. I leave Linux and mac boxes on the internet (often without a firewall) all the time and haven't had a virus in 7 years. The design of these operating systems is fundamentally different than Windows.
With Linux, you can easily built and lock down a system that matches only the functionality you need for your application. It gives you total control and the ability to audit any part of the system without having to get permission.
Secondly, can a computer virus be designed to propagate through the
Pilot Port?  This port is a two way interconnection into the
navigation network and therefore it would be possible for a connected
computer to feed corrupt data into the network.

It is certainly possible to dream up relatively simple viruses that
would achieve this mischievously. Such viruses could potentially enter
the computer by poor IT practices, perhaps when not connected to the
Pilot Port and being used for other applications.
...
All possibilities of harm could in fact be prevented if an adaptor box
was specifically designed to prevent the computer connected to the
Pilot Port from feeding any data onto the network.
I have a couple of thoughts on this. First, if we had a standardize machine readable language to define AIS Binary Messages (see my XML papers), then vendors would have an easier time adding new messages to their software.
Next, I forget which signal type runs on a pilot port (RS-232, 422, 488), but just provide the computer with the listening lines. Any device so connected can hear all of the NMEA scentences, but can not cause trouble. Or someone can grab a small embedded computer and write some quick NMEA filtering code. Then route the connection through the two serial ports. This is the same idea as firewalls for computers.
Finally, I have to remind vendors and authorities that produce software - there are more secure platforms than Windows. OpenBSD is probably the most secure operating system generally available. If that is too unusual for you, consider Linux with tools like App Armor. I leave Linux and mac boxes on the internet (often without a firewall) all the time and haven't had a virus in 7 years. The design of these operating systems is fundamentally different than Windows.
With Linux, you can easily built and lock down a system that matches only the functionality you need for your application. It gives you total control and the ability to audit any part of the system without having to get permission.
04.26.2009 15:32
GAO Report on Maritime Security - AIS and LRIT
The US Government Accountability
Office has released GAO-09-337: MARITIME SECURITY: Vessel
Tracking Systems Provide Key Information, but the Need for
Duplicate Data Should Be Reviewed. This is the April release of
a classified March version. This is the first that I've heard about
this study. Thanks to Mark Friese for the info.
On April 20th, the USCG iCommandant blog has a post by Dana Goward indirectly responding to the GOA report: Maritime Domain Awareness -- The Whole is Greater than the Sum of its [parts] [title is clipped]:
I'm just starting to read through the 54 page GAO report and have some observations and speculation. Remember, I do not and never have had a security clearance above a "National Access Check (NAC)" and that was with NASA. I've been in the Seattle VTS center, but not in the classified area.
On page one, the GAO states:
I'm wondering what this "national technical means" is such that they can't say what it might be. A quick speculation of what it might be starts with the platforms that might be in use:
The report talks about using radar (possibly implying ground based traditional radar), video cameras, and Notice of Arrival sent by vessels as ways that vessels are tracked. Here are some remote sensing techniques that might be in use:
Also not mentioned in the report are VOS and AMVER systems where vessel have been self reporting locations for a long time. A ways down in the report, they hint at what they are hiding:
Also, I found this quote interesting. Based on what I see in AIS feeds, we need better monitoring right now for anomalies.
On April 20th, the USCG iCommandant blog has a post by Dana Goward indirectly responding to the GOA report: Maritime Domain Awareness -- The Whole is Greater than the Sum of its [parts] [title is clipped]:
...
Two of the means the Coast  Guard is pursuing to enhance our awareness
of the  maritime domain are the Automatic  Identification System (AIS)
and  global  Long Range  Identification  Tracking  (LRIT).  I want  to
address  the inaccurate  arguments  suggesting these  systems are  not
being properly coordinated and their capabilities are redundant.

While AIS and LRIT are complementary, they provide different types of
information, apply to different classes and sizes of vessels, and are
being developed under separate statutory and international
mandates. LRIT, which became mandatory on 01 January 2009 for
passenger vessels and cargo vessels over 300 gross tons conducting
international voyages, is a mandated system by the International
Maritime Organization (IMO). AIS will be required for most vessels
over 65ft in U.S. waters and was mandated by the Congress under the
Maritime Transportation Security Act of 2002. It is also a global
system required under the International Safety of Life at Sea (SOLAS)
convention.
...
The whole vessel tracking and security issue is timely and many others are talking about it. For example, NavGear just had an article, Vessel tracking system roundup, that talks about other ways to track vessels.
I'm just starting to read through the 54 page GAO report and have some observations and speculation. Remember, I do not and never have had a security clearance above a "National Access Check (NAC)" and that was with NASA. I've been in the Seattle VTS center, but not in the classified area.
On page one, the GAO states:
For tracking vessels at sea, the Coast Guard uses existing national
technical means-classified methods of tracking vessels-and plans to
obtain vessel identification and tracking information from two more
sources, long-range identification and tracking system (LRIT), and
commercially provided long-range automatic identification system
(AIS).
(emphasis added)
I'm wondering what this "national technical means" is such that they can't say what it might be. A quick speculation of what it might be starts with the platforms that might be in use:
- Spacecraft
- Aircraft (manned and unmanned; planes, helocopters, blimps, balloons, kites)
- Ships - both patrol and vessels of opportunity
- Buoys
- Offshort platforms
- Shore stations
- Submarines
- ROV/AUV underwater vehicles and autonmous surface vessels
- Moorings in the water column
- Sea floor stations
- Spotters and other human intelligence at ports foreign and domestic
- Communication taps (e.g. internet, phone, and other data streams) NSA style
The report talks about using radar (possibly implying ground based traditional radar), video cameras, and Notice of Arrival sent by vessels as ways that vessels are tracked. Here are some remote sensing techniques that might be in use:
- Space based radar, thermal, and visual band imaging
- Radio direction finding
- Acoustic receivers - e.g. SOSUS
- Close up thermal imaging of vessels - to guesstimate intention
- Grabbing position and data from Cell phone and other communications
- Magnetometers
Also not mentioned in the report are VOS and AMVER systems where vessel have been self reporting locations for a long time. A ways down in the report, they hint at what they are hiding:
The United States' history of using national technical means for
remote tracking of vessels on the high seas goes back many years, but
at the time Soviet warships-rather than commercial vessels-were the
target of this tracking. Such means have been continually in place
since that time, but their mission has grown from tracking potential
military adversaries to tracking a wide variety of vessels, both
military and nonmilitary, that are of interest to the United States.
I'm less than half way through the report. I have lots of questions. For example, I am confused as to what they mean by "commercially provided long-range AIS." How is that different from N-AIS?
Also, I found this quote interesting. Based on what I see in AIS feeds, we need better monitoring right now for anomalies.
The Coast Guard is developing software programs for tracking the
expected activity of a port over time and warning the Coast Guard when
unexpected activity occurs, but according to Coast Guard officials,
such programs will take years to be fully operational.
04.26.2009 08:57
USCG Google Earth Layer
I did the USCGC Healy Aloftcon
visualization for the USCG Google Earth layer. Here is the
announcement and the entry in the Google Earth Outreach
section.
Wednesday, April 22, 2009 - Google Earth Outreach -- U.S. Coast Guard Environmental StewardshipEfforts
Author: United States Coast Guard
I like their spill icon...

Wednesday, April 22, 2009 - Google Earth Outreach -- U.S. Coast Guard Environmental StewardshipEfforts
Coast Guard Google Layer

Originally uploaded by icommandant
Guest post by VADM David Pekoske, Pacific Area Commander:

For the past month, the Coast Guard has been providing information to
Google on ways to better inform and engage the public in its many
missions. Today, Earth Day 2009, Google will publish a gallery of
environmental layers within the Oceans layer of Google Earth, Google
Maps Version 5.0, highlighting environmental stewardship activities of
groups around the world. The Coast Guard will proudly be featured in
this gallery.

This layer lets you view descriptions and photographs of Coast Guard
efforts to protect and conserve the environment in the Pacific
including environmental response, energy conservation, marine debris
cleanups, fisheries and sanctuary enforcement, polar operations and
wildlife conservation initiatives. Via this layer, you can follow
along the Coast Guard Cutter HEALY's Arctic Deployment and view hourly
position and webcam footage. You can also explore and learn about
recent Coast Guard responses and initiatives from efforts to prevent
vessel strikes of whales in the Santa Barbara Shipping Channel to an
overview of Training Center Petaluma's planned solar array--the Coast
Guard's first power purchase agreement ever!
Earth Outreach KML: U.S. Coast Guard Environmental Stewardship Efforts
Author: United States Coast Guard
The U.S Coast Guard is a maritime, multi-mission, military service
within the Department of Homeland Security and one of the nation's
five armed services. The U.S. Coast Guard is also a strong
environmental steward and this layer showcases Coast Guard efforts to
protect and conserve the environment in the Pacific including
environmental response, energy conservation, marine debris cleanups,
fisheries and sanctuary enforcement, polar operations and wildlife
conservation initiatives. Come explore the Coast Guard and learn how
to assist them in protecting the environment by providing direct
feedback on illegal fishing, pollution, and issues relevant to Coast
Guard missions!
I like their spill icon...
04.25.2009 09:50
Ubuntu 9.04
I've got my first machine up to 9.04.
This one started at 7.10 and had some real troubles on release day
getting to 8.10 and locked up when trying to reboot the machine
after it finished updating all the deb packages. However,
yesterday, it went from 8.10 to 9.04 without any trouble. Took
about 3-4 hours to do the update. All I had to do was run
"do-release-upgrade" and wait to get a jaunty
Linux hostname 2.6.28-11-generic #42-Ubuntu SMP Fri Apr 17 01:57:59 UTC 2009 i686

The programs included with the Ubuntu system are free software;
the exact distribution terms for each program are described in the
individual files in /usr/share/doc/*/copyright.

Ubuntu comes with ABSOLUTELY NO WARRANTY, to the extent permitted by
applicable law.

To access official Ubuntu documentation, please visit:
http://help.ubuntu.com/

  System information as of Sat Apr 25 09:40:01 EDT 2009

  System load: 0.0                Memory usage: 11%   Processes:       133
  Usage of /:  3.7% of 226.36GB   Swap usage:   0%    Users logged in: 1

  Graph this data and manage this system at https://landscape.canonical.com/

0 packages can be updated.
0 updates are security updates.

Last login: Fri Apr 24 17:13:53 2009 from some.other.host
Asking the box about itself, here is what I see:
% cat /etc/lsb-release
DISTRIB_ID=Ubuntu
DISTRIB_RELEASE=9.04
DISTRIB_CODENAME=jaunty
DISTRIB_DESCRIPTION="Ubuntu 9.04"
Today, things are going much faster. The updates for the next box are going at 300 to 1000kB/s.
04.24.2009 16:48
USCG Photography
Luke Pinneo has some really nice
photos of the USCG. Google
Image Search. e.g. this USCG released image:

04.24.2009 11:46
Norfolk vessel traffic
For the talk that Brian Calder and I
are giving today, I've been building a Google Earth visualization
of the Norfolk/Hampton Roads vessel transits from AIS. There is a
good bit of hand tweaking to get all the colors set right. This
covers Oct and Nov of 2008. The unlabeled yellow edged boxes are my
regions around the k-means estimate of the clusters of vessel end
points. The white line is the bounds of our study area in the US
Hydro paper. There is a lot of occlusion of other traffic by the
orange tug transit lines.

04.24.2009 07:32
Small vessels interacting with large
Coast Guard Urges Recreational Boaters to Be Aware of Boating
Safety Laws [USCG]
SAN PEDRO, Calif. -In light of recent near misses and the start of the
2009 boating season, the Coast Guard will be increasing the
enforcement of small vessel navigation rules. There have been several
recent near misses in and around the Ports of Los Angeles and Long
Beach which were the direct result of dangerous maneuvers by small
craft impeding the movement of large commercial vessels. Reports
include small craft impeding port channels, cutting through Pilot
Operating Areas, and cutting across the path of large ocean going
shipping, all violations of federal regulations.

Recreational, commercial fishing, and small passenger vessels must use
extra care when transiting in port channels, Pilot Operating Areas, as
well as the entire Precautionary Area. The Precautionary Area is a
convergence zone for the two major shipping lanes in the Los Angeles
and Long Beach area and extends approximately seven nautical miles
from the federal breakwater.
...
04.23.2009 22:26
Right whale sightings with time and traffic lanes
Thanks to a Googalite for telling me
how I can set the time slider for a dataset. Before, I cut out the
TimeStamp nodes because the view was coming up with no whales
visible and it was confusing. By adding the gx namespace and
setting an overall view with a gx:TimeSpan, the placemarks open up
and set the time range to show all the whale sightings.

<?xml version="1.0" encoding="UTF-8"?>
<kml xmlns="http://earth.google.com/kml/2.0" xmlns:gx="http://www.google.com/kml/ext/2.2" >
<Document><Folder>
  <LookAt>
    <gx:TimeSpan>
      <begin>2009-01-04</begin>
      <end>2009-04-01</end>
    </gx:TimeSpan>
    <longitude>-70.94</longitude>
    <latitude>40.77</latitude>
    <altitude>0</altitude>
    <range>801077.2</range>
    <tilt>37.27</tilt>
    <heading>-44.46</heading>
    <altitudeMode>relativeToGround</altitudeMode>
  </LookAt>
<!-- ... -->
I also added a subset of the S-57 charts from Christin.
% ogr2ogr -f KML traffic-lanes.kml traffic-lanes.shp2009-ne-rightwhale-sightings-with-time.kmz
04.23.2009 18:49
Spring
I just missed a really great
picture... if only I had realized that I had a real camera in my
bag while commuting home today.

The flowers are here. The trees have a while to catch up.

The flowers are here. The trees have a while to catch up.
04.23.2009 11:50
Updating Ubuntu Linux for servers
My datalogging boxes and servers all
run Ubuntu. Today, I'm updating
one of our field dataloggers from 7.10 to the latest. However, I
probably picked a bad day to do the updating.. 9.04 was
released today (Ubuntu
9.04 Released [slashdot]), so I'm seeing only 92kB/s on the
update. After many hours I'm still somewhere between 8.04 and 8.10.
I'm seeing 60-150kB/s from a Internet2 IP, so I don't think the
bandwidth problem is at my end.
Some notes on updating....
I had to use the GUI update manager. And it stalled out on on the post-install of locales. About 5 times, I had to do a ps, find the stuck localdef, and kill it. Then I had to reboot afterwards to kill one of the instances that wouldn't respond to any of the 15 signal types I threw at it.
I did some permutation of:
sudo apt-get dist-upgrade
sudo apt-get update-manager-core
sudo do-release-upgrade
sudo update-manager -d
I got turned around by a custom firewall that was blocking DNS lookups. Points to Lester for being first to guess that it was a firewall problem. But in the process, I'm not sure what finally was the key sequence to doing the upgrades.
04.23.2009 11:31
El Cheapo core logger
Bumped into this photo today...
This was a few years back Feb 2002 when I had no access to a core logger, so I tried to build my own. That's Warren Smith inspecting what I had built. Measuring just magnetic susceptibility with a Bartington device.

This was a few years back Feb 2002 when I had no access to a core logger, so I tried to build my own. That's Warren Smith inspecting what I had built. Measuring just magnetic susceptibility with a Bartington device.
04.23.2009 06:33
GSA Session on Virtual Globes
Peter Selkin just
sent me a note letting me know that the October GSA meeting in
Portland, OR will have a virtual globes sessions.
On Peter's Blog
P6. Google Earth to Geoblogs: Digital Innovations in the Geosciences, Sun., 18 Oct., 1:30-5 p.m.
The usual cast of very interesting research and development folks, plus a couple I don't know.
On Peter's Blog
P6. Google Earth to Geoblogs: Digital Innovations in the Geosciences, Sun., 18 Oct., 1:30-5 p.m.
The usual cast of very interesting research and development folks, plus a couple I don't know.
P. Kyle House, University of Nevada, Reno, Nev.
John Bailey, University of Alaska, Fairbanks, Alaska
Ronald C. Schott, Fort Hays State University, Hays, Kans.
Mano Marks, Google Inc., Mountain View, Calif.
Glenn A. Richard, Stony Brook University, Stony Brook, N.Y.
Peter A. Selkin, University of Washington, Tacoma, Wash.

Digital technologies such as Web 2.0 services, virtual globes, and new
applications of digital photography can enhance understanding of
geology at all levels and across all disciplines. This session will
highlight particularly novel and innovative applications of these
technologies.
04.22.2009 23:14
2009 Right Whale sightings
I've been working with Tim Cole at
NOAA on a project to visualize the NE Right Whale sightings. Here
is a KMZ for Google Earth for 2009. This is a static demo that I
will not be updating with new sightings. I've modified the icon a
bit - softening the edges of the splashes - to give a better look
in Google Earth.
2009-ne-rightwhale-sightings-static.kmz

2009-ne-rightwhale-sightings-static.kmz
04.22.2009 21:57
Healy sunrise
I'm not on the USCGC Healy, but with
my new GeoRSS feed, it's easy to catch up with the view out the
front of the vessel. This sunrise came across the feed today.
20090422-1601.jpeg

20090422-1601.jpeg
04.22.2009 21:36
Using a layer mask of an image to control transparency
I couldn't figure out how to get
Photoshop to allow me to paste an image into the layer mask in
Photoshop, so I decided it was time to pull out the big guns. I
talked to Joel Hagen and
two minute later I had what I wanted. I've worked with Joel on a
number of spacecraft missions over the last 12 years... Joel is a
master of design with Photoshop. Here is generally what I
did:
First, I started with a photo of a Right Whale tail. I turned the image from color to gray scale. Then I altered the levels by doing Image->Adjust->Levels. I pulled in the two outer bounds of the image and then tweaked the outer bounds to give a mostly black tail, some water highlights, and otherwise white image. I used the eraser to knock down the left over sky artifacts. I used the the blur tool on the water to soften up the deep shadows that I had created. Finally, I touched up the whale to remove the markings that would identify the individual whale.
Then I copied the image to a separate buffer and did Image->Adjustments->Invert. I copied this to the clipboard.
Then I went back to the original layer, made the image RGB and hit the "Add layer mask" icon on the bottom of the Layers view (small red circle). Then I switched over to the Channels view.

Then I had to go to the "Layer 2 Mask", activate the layer to get the eyeball on the left. I then selected the layer so that it was light blue and did a paste.

This shows the process with early on the left and a final on the right.

I might have to do a bit more work for this to come out right in Google Earth, but I am very pleased with the results.
Update: The final result that I used in my Google Earth visualization:

First, I started with a photo of a Right Whale tail. I turned the image from color to gray scale. Then I altered the levels by doing Image->Adjust->Levels. I pulled in the two outer bounds of the image and then tweaked the outer bounds to give a mostly black tail, some water highlights, and otherwise white image. I used the eraser to knock down the left over sky artifacts. I used the the blur tool on the water to soften up the deep shadows that I had created. Finally, I touched up the whale to remove the markings that would identify the individual whale.
Then I copied the image to a separate buffer and did Image->Adjustments->Invert. I copied this to the clipboard.
Then I went back to the original layer, made the image RGB and hit the "Add layer mask" icon on the bottom of the Layers view (small red circle). Then I switched over to the Channels view.
Then I had to go to the "Layer 2 Mask", activate the layer to get the eyeball on the left. I then selected the layer so that it was light blue and did a paste.
This shows the process with early on the left and a final on the right.
I might have to do a bit more work for this to come out right in Google Earth, but I am very pleased with the results.
Update: The final result that I used in my Google Earth visualization:
04.22.2009 17:06
Friday - Brian and I will give the CCOM seminar
Come join the discussion this Friday
at the CCOM seminar.

04.22.2009 10:12
Right Whale AIS notices - temp outage 1 HR
Update: The server update is finished
and things should be back online.
Cornell is doing some work on their end. The right whale messages for the Boston Approaches will resume in about an hour.
Operations Resume at Excelerate's Northeast Gateway LNG Deepwater Port
Cornell is doing some work on their end. The right whale messages for the Boston Approaches will resume in about an hour.
Operations Resume at Excelerate's Northeast Gateway LNG Deepwater Port
...Reuters reports that Excelerate Energy will begin delivery of
an LNG cargo to the Northeast Gateway LNG deepwater port this
week. ...
04.21.2009 10:55
Optical Character Recognition (OCR)
Last week, Alex (ACD)
gave me a hand evaluating the potential to pull positions out of
the text written on the Healy Aloftcon images. He suggested looking
at GOCR/JOCR and if that
didn't work, to try tesseract-ocr
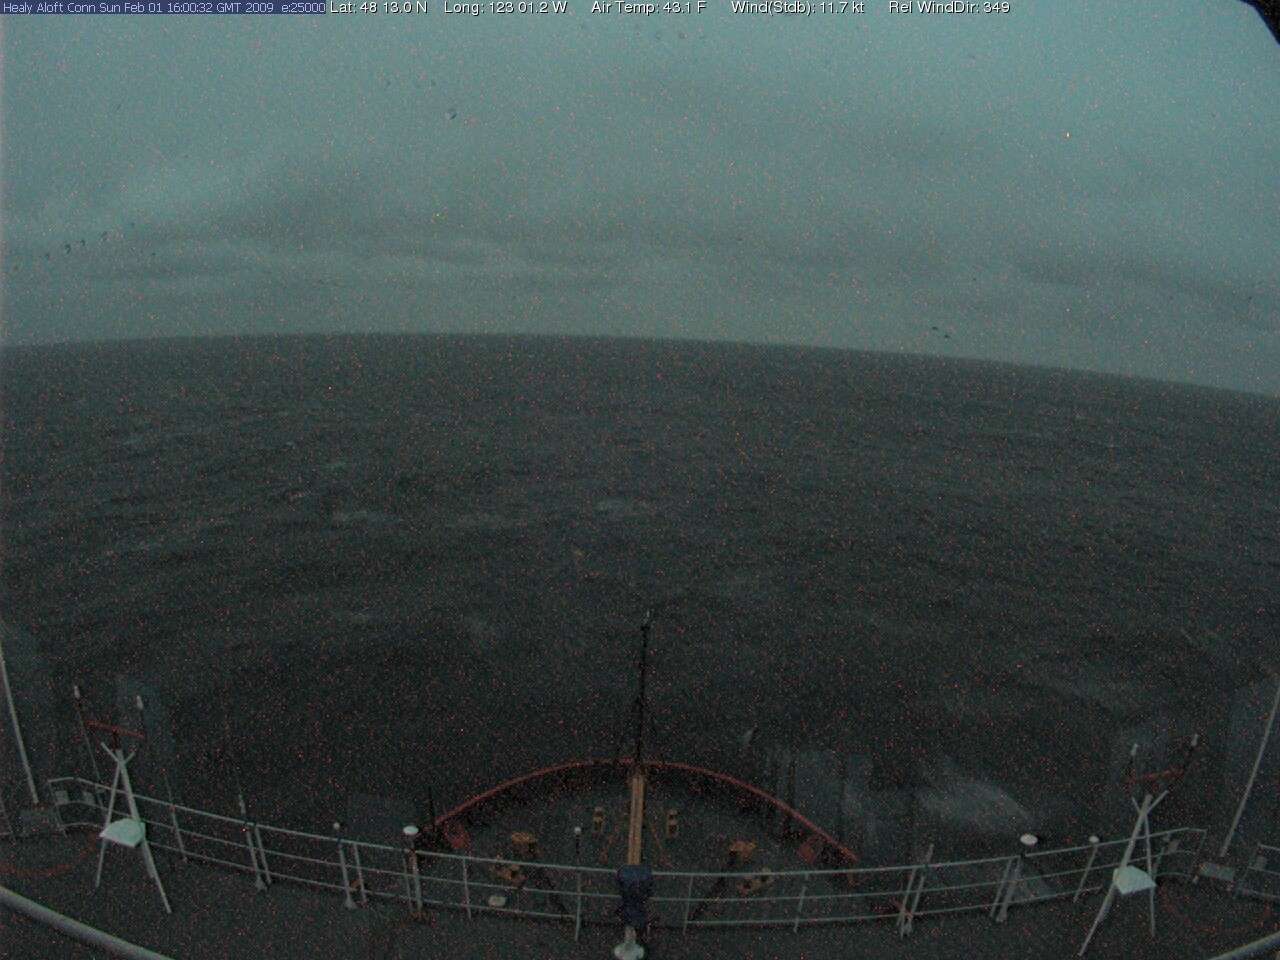
I was able to give GOCR a try with moderate success, but don't have the time to look into it more. I started with an aloftcon image: 20090201-1601.jpeg


I was able to give GOCR a try with moderate success, but don't have the time to look into it more. I started with an aloftcon image: 20090201-1601.jpeg
% fink install gocr
% gocr 20090201-1601.jpeg
,' .!Oft CaOnC Sv0C Fb, 01,16,,O,t Ow.p3,,GM0T02,Q,O, 2O,O,?d'^,?'n'>',&?^ aaog 'nd03?9V??,''?'i9?  ???v? ,'D?",,?  ???i,'c,i,'0t,  0o  clq?p6;tgg?,
        , , '',    ' ..
;'..'i..;î'.',..'oo..?P0'0,,,F,,0,,D'?,,'U0O',,,,,,,',,,,p0,,,,,,  ,,   ,      , ,   ,,     '                           , ,,,,,,',n,O,0-
:,.,.ti'''.. !,.   ', t. . 00 0 0vOnO08c,B' 8 0,8,00,,,,,n8'0'8,,,  00    ,,,        ,  ,            l,    0,,,p08 '''
'  :', ' :''  ''i'r.l?',  t.   '   '   .l     , :,  .    08''   '  ...Wr :: '' ,0,,,q, g  ,   ,,  ,   , ' 00'B 0,  8,
...
The first line looks like it might be seeing the text and after
that, it degenerates into interpreting the noise. We then tried
cropping the image and making it gray scale.
% gocr gray-crop.jpg
=C 00uuu=06i0csJ;000 =000 ci ,v c rW,2,M'-'!   er!n,.tr 3;x4X
It probably does not help that there are two different fonts here and that there are substantial JPEG compression artifacts. Croping to just the position that I'd like to parse doesn't really help.
% gocr gray-crop2.jpg
, lt,3 e'l,,,,
However, thresholding the image has better results, but is not quite there.
% gocr gray-crop3.jpg
48 1 3.C N
Closer. Trying to constrain the characters does not appeart to change how it is matching.
% gocr -C "0123456789.NSEW " gray-crop3.jpg
48 1 3. N
And changing the certainty still does not let it pick up the 0.
% gocr -a 0 -C "0123456789.NSEW " gray-crop3.jpg
48 1 3. N
Setting the space width helps with the spacing, but still doesn't get the 0.
% gocr -a 0 -C "0123456789.NSEW " gray-crop3.jpg -s 9
48 13. N
Turning up the verbosity gives some info on what it is seeing.
% gocr -C "0123456789.NSEW " gray-crop3.jpg -v 4
# list shape for charlist _
# list shape   5 x=  47    2 d=   7  10 vf=1 ac=0 e000 (?)
# list box      x=   47    2 d=   7  10 r=   1   0 nrun=0 p=0x802a00
#  dots=0 boxes=1 subboxes=0 c=(?) mod=(0x00) line=1 m= 0 2 9 12
#  frames= 1 (sumvects=22)
#  frame 0 ( +26, 43,22)  #00  1  0 #01  1  1 #02  0  2 #03  0  8 #04  1  \
  8 #05  2  9 #06  4  9 #07  5  8 #08  5  7 #09  6  6 #10  6  3 #11  5  \
  3 #12  6  4 #13  6  6 #14  3  9 #15  2  9 #16  0  7 #17  0  2 #18  2  \
  0 #19  4  0 #20  5  1 #21  5  0
# list pattern  x=   47    2 d=   7  10 t= 1 1
.$$@$$.  .@@@@@.<-
.$...$.  .@...@.
$......  @......<
@....$$  @....@@
@.....$  @.....@
@.....@  @.....@
@.....$  @.....@
$....$.  @....@.
$$..@$.  @@..@@.
..$$$..  ..@@@..<-
And that is about all I have time for right now. I am sure that with more time spent on the filtering, an imagemagick script could be setup to give a reliable decoding of the text.
04.21.2009 10:06
Northeast Right Whale Sightings in Google Earth
My latest project is a collaboration
with NOAA/WHOI
Rightwhale Sightings... Here is a draft visualization of the
right whale sightings database as seen in Google Earth.


04.20.2009 13:05
Healy Google Earth Viz take 2
I've worked some more on the Healy Aloftcon in
Google Earth. Virgil
Zetterlind pointed out that I should be using a KML
NetworkLinkControl node.
A while back, I tried to package libkml for fink, but it was a bit of trouble. I should try again soon.
<?xml version="1.0" encoding="UTF-8"?>
<kml xmlns="http://earth.google.com/kml/2.0">
  <NetworkLinkControl>
    <minRefreshPeriod>600</minRefreshPeriod>
    <linkName>Healy Aloftcon Camera 20 Apr 16:00</linkName>
    <expires>2009-04-20T18:02:10Z</expires>
  </NetworkLinkControl>
  <Document>
    <name>Healy Aloftcon Camera 20 Apr 16:00</name>
<!-- ... -->
</Document>
</kml>
I've released
the first draft of the code... Be warned: this code is not
pretty or well designed, but it does get the job done. I don't even
have a setuptools setup.py or a PyPi entry yet.A while back, I tried to package libkml for fink, but it was a bit of trouble. I should try again soon.
04.18.2009 17:59
USCGC Healy track and images in Google Earth
What timing. I just found out that
National Geographic has an article on the CCOM/JHC Law of the Sea
mapping this month: Healy
Mapping Mission - Arctic Landgrab.
I'm just now finishing up a short project this week to put the Healy Aloftcon images into Google Earth such that you can see the vessel track and the hourly images that are sent over the satellite link:
Healy Aloftcon in Google Earth
I've got a small kml file with a NetworkLink that checks every 10 minutes: healy-aloftcon-updating.kml. I could figure out how to tell Google Earth to only check just after I run the update cron job every hour.


I'm also creating a GeoRSS Simple feed that you can use to see the images. healy-aloftcon-latest.georss. I've likely made mistakes in creating this feed as this is my first try. If you know GeoRSS and can offer advice, I am all ears. Things like specifying coordinates in y,x threw me off.
I'm just now finishing up a short project this week to put the Healy Aloftcon images into Google Earth such that you can see the vessel track and the hourly images that are sent over the satellite link:
Healy Aloftcon in Google Earth
I've got a small kml file with a NetworkLink that checks every 10 minutes: healy-aloftcon-updating.kml. I could figure out how to tell Google Earth to only check just after I run the update cron job every hour.
I'm also creating a GeoRSS Simple feed that you can use to see the images. healy-aloftcon-latest.georss. I've likely made mistakes in creating this feed as this is my first try. If you know GeoRSS and can offer advice, I am all ears. Things like specifying coordinates in y,x threw me off.
<?xml version="1.0" encoding="UTF-8"?>
<feed xmlns:dc="http://purl.org/dc/elements/1.1/"
  xmlns:georss="http://www.georss.org/georss"
  xmlns:sy="http://purl.org/rss/1.0/modules/syndication/"
  xmlns="http://www.w3.org/2005/Atom">

  <language>en</language>
  <sy:updatePeriod>hourly</sy:updatePeriod>
  <sy:updateFrequency>1</sy:updateFrequency>

  <title>USCGC Healy Aloftcon Camera</title>
  <link href="http://vislab-ccom.unh.edu/~schwehr/healy/healy-aloftcon-latest.georss" rel="self"/>
  <id>http://vislab-ccom.unh.edu/~schwehr/healy/healy-aloftcon-latest.kml</id>
  <updated>2009-04-18T21:01:00Z</updated>
  <generator uri="http://schwehr.org/">Kurt Schwehr</generator>

  <entry>
    <title>Aloftcon Image</title>
    <author>
      <name>USCGC Healy</name>
    </author>
    <georss:point>61.6616666667 -167.776666667</georss:point>
    <published>2009-04-18T21:01:00Z</published>
    <content type="html"><![CDATA[
      <a href="http://www.uscg.mil/pacarea/cgcHealy/">USCGC HEALY (WAGB-20)</a><br/>
      UTC time: 20090418-2101<br/>
      Longitude: -167.776666667   Latitude: 61.6616666667<br/>
      <a href="http://mgds.ldeo.columbia.edu/healy/reports/aloftcon/2009/20090418-2101.jpeg">Full size image</a><br/>
      <img width="300" height="225" src="http://mgds.ldeo.columbia.edu/healy/reports/aloftcon/2009/20090418-2101.jpeg"/>
     ]]></content>
  </entry>

  <!-- ... more entries ... -->

</feed>
I've not yet done the site map that google requests...
What is a Geo Sitemap?04.18.2009 06:35
Tips for working with MS Access Jet DB files
If anybody has an alternate point of
view or other suggestions, please send them my way.
MS Access is an easy way for people to quickly create a database, even if they have never used databases before. However, MS Access doesn't do a great job of giving background on how you should setup a DB. Here is a short set of suggestions for people who are creating new databases with spatial content. Before you begin, think carefully about your requirements and consider PostgreSQL+PostGIS, MySQL+Spatial Extensions, or SQLite+Spatial Lite.
A few general comments: For all of your critical fields, set the Required attribute to "Yes" such that people have to enter in a value. For your field names, make sure to avoid spaces or symbols. If you stick to characters, numbers, and the underscore, it will be easier to migrate your data to other databases if the need ever arises - this is something that comes up all the time. Back in March of 2008, I talked a bit about using mdbtools to dump SQL statements from an Access DB (Jet DB format) with the mdb-export command - this tips make it easier to import your data into other databases.
It is generally a good idea to give every table a primary key (the key icon in the left column). The primary key is often an automatically created index number (AutoNumber) and should be unique such that there is only one instance of any particular number.
Next, make sure that you create your coordinates as numbers with WGS84 decimal degrees. Use the sign of the number to specify the hemisphere - do not use N, S, E, W. Do not use degrees minute seconds inside the database. You can always provide this format later in the presentation layer of any application.
Finally, you generally want a timestamp with your observation. Make sure it is a Date/Time type and always use UTC timestamps. If you use some other timezone and you data ends up in the hands of someone in another timzezone or worse your data is being collected by people in different timezones, things will get out of hand. Also, keep all data of the same type together. Don't break your database tables on time periods (e.g. one for each year). The overall rule is to try to keep things consistant.
Hopefully, if you follow these tips, you will have a database that surveys you well and makes analysis go quickly. For those who are used to saying "lat long," I argue for aways writing "long lat" so that the data always appears in "x y" order.

Here is a quick tips for when someone sends you an Access DB. I wasn't able to open a database. I tried duplicating the file, but no luck. I just kept getting this error:

Matt helped me figure out that I needed to "Unblock" the database. Then it worked as expected.

MS Access is an easy way for people to quickly create a database, even if they have never used databases before. However, MS Access doesn't do a great job of giving background on how you should setup a DB. Here is a short set of suggestions for people who are creating new databases with spatial content. Before you begin, think carefully about your requirements and consider PostgreSQL+PostGIS, MySQL+Spatial Extensions, or SQLite+Spatial Lite.
A few general comments: For all of your critical fields, set the Required attribute to "Yes" such that people have to enter in a value. For your field names, make sure to avoid spaces or symbols. If you stick to characters, numbers, and the underscore, it will be easier to migrate your data to other databases if the need ever arises - this is something that comes up all the time. Back in March of 2008, I talked a bit about using mdbtools to dump SQL statements from an Access DB (Jet DB format) with the mdb-export command - this tips make it easier to import your data into other databases.
It is generally a good idea to give every table a primary key (the key icon in the left column). The primary key is often an automatically created index number (AutoNumber) and should be unique such that there is only one instance of any particular number.
Next, make sure that you create your coordinates as numbers with WGS84 decimal degrees. Use the sign of the number to specify the hemisphere - do not use N, S, E, W. Do not use degrees minute seconds inside the database. You can always provide this format later in the presentation layer of any application.
Finally, you generally want a timestamp with your observation. Make sure it is a Date/Time type and always use UTC timestamps. If you use some other timezone and you data ends up in the hands of someone in another timzezone or worse your data is being collected by people in different timezones, things will get out of hand. Also, keep all data of the same type together. Don't break your database tables on time periods (e.g. one for each year). The overall rule is to try to keep things consistant.
Hopefully, if you follow these tips, you will have a database that surveys you well and makes analysis go quickly. For those who are used to saying "lat long," I argue for aways writing "long lat" so that the data always appears in "x y" order.
Here is a quick tips for when someone sends you an Access DB. I wasn't able to open a database. I tried duplicating the file, but no luck. I just kept getting this error:
Matt helped me figure out that I needed to "Unblock" the database. Then it worked as expected.
04.17.2009 13:48
Healy Aloftcon now with GPS
Steve Roberts has added GPS EXIF tags
to the Healy Aloftcon images. e.g.20090417-1701.jpeg
% exiftool 20090417-1701.jpeg  | grep GPS
GPS Version ID                  : 2.2.0.0
GPS Latitude Ref                : North
GPS Longitude Ref               : West
GPS Latitude                    : 61 deg 55' 48.00" N
GPS Longitude                   : 171 deg 12' 42.00" W
GPS Position                    : 61 deg 55' 48.00" N, 171 deg 12' 42.00" W
04.17.2009 13:08
Chart of the Future - Norfolk, VA - May 11th
Here is the announcement for the May
11th Chart of the Future (CotF) meeting in Norfolk, VA.
Registration for US Hydro not required. Both of images in the flier
are by Matt Plumlee of the CCOM Vislab.
Chart-of-the-Future_05112009.pdf

I've got a number of videos related to the Chart of the Future on YouTube. Don't forget to check page 2 of the videos.
Chart-of-the-Future_05112009.pdf
I've got a number of videos related to the Chart of the Future on YouTube. Don't forget to check page 2 of the videos.
04.16.2009 13:53
Towing practice
Spring in here and our vessels are
getting out on the water. With that comes time for training. Today,
I was a deck hand as the R/V Coastal Surveyor and R/V Cocheco
practiced towing. First we did on the side tows and then we
switched to front-to-back towing.


We weren't the only ones out on the water getting practice in... the USCG gave us a wave and then headed out to run their own towing drills.

And some nice shots...

And the S/V Mother of Perl with the Cocheco in the background (on the left)

We weren't the only ones out on the water getting practice in... the USCG gave us a wave and then headed out to run their own towing drills.
And some nice shots...
And the S/V Mother of Perl with the Cocheco in the background (on the left)
04.16.2009 07:14
Adding GPS EXIF tags to an image
While there are many tools that now
read GPS exif tags (e.g. jhead), most of them either can't write
the headers or don't provide a way to write EXIF fields or make it
difficult. ExifTool makes
it easy. On a Ubuntu Linux box. Here is the before:

See also: Write GPS data on your photos with Exiftool
% sudo apt-get install libimage-exiftool-perl
% wget http://mgds.ldeo.columbia.edu/healy/reports/aloftcon/2009/20090201-1601.jpeg
% exiftool 20090201-1601.jpeg
ExifTool Version Number         : 7.30
File Name                       : 20090201-1601.jpeg
Directory                       : .
File Size                       : 114 kB
File Modification Date/Time     : 2009:02:01 11:01:45
File Type                       : JPEG
MIME Type                       : image/jpeg
JFIF Version                    : 1.1
Resolution Unit                 : inches
 Resolution                    : 72
Y Resolution                    : 72
Comment                         : Sun Feb 01 16:00:32 2009
Image Width                     : 1280
Image Height                    : 960
Encoding Process                : Baseline DCT, Huffman coding
Bits Per Sample                 : 8
Color Components                : 3
Y Cb Cr Sub Sampling            : YCbCr4:2:0 (2 2)
Image Size                      : 1280x960
Now to add the GPS tags.
% exiftool -GPSLongitudeRef=W 20090201-1601.jpeg
% exiftool -GPSLongitude=123.02 20090201-1601.jpeg
% exiftool -GPSLatitudeRef=N 20090201-1601.jpeg
% exiftool -GPSLatitude=43.216666 20090201-1601.jpeg
% exiftool 20090201-1601.jpeg | grep GPS
GPS Version ID                  : 2.2.0.0
GPS Latitude Ref                : North
GPS Longitude Ref               : West
GPS Latitude                    : 43 deg 12' 60.00" N
GPS Longitude                   : 123 deg 1' 12.00" W
GPS Position                    : 43 deg 12' 60.00" N, 123 deg 1' 12.00" W
The resulting tagged image: 20090201-1601-with-exif-gps.jpeg
See also: Write GPS data on your photos with Exiftool
04.15.2009 22:41
Bay Hydro II dedication
I
recently posted about the Bay Hydro II. It's now
official.
NOAA Dedicates New Chesapeake Bay Research Vessel
NOAA Dedicates New Chesapeake Bay Research Vessel
NOAA today christened a new state-of-the-art research vessel, R/V Bay
Hydro II, which will collect oceanographic data in the Chesapeake Bay
region - data critical to safe navigation and environmental protection
in the nation's largest estuary. The dedication took place in
Baltimore's Inner Harbor, featuring a ceremonial breaking of a
champagne bottle over the bow and a cannon salute from the USS
Constellation.

"R/V Bay Hydro II serves as NOAA's 'eyes' to the seafloor of the
Chesapeake Bay," said Mary Glackin, deputy under secretary for oceans
and atmosphere. "Since human eyes can't see to the seafloor, R/V Bay
Hydro II's state-of-the-art equipment ensures NOAA can continue
providing the nation with timely and accurate charts and quality
science."
...
04.15.2009 14:36
2 more Class B AIS transcievers
Today, I received an ACR COBHAM
Nauticast Class B "Transponder" and a Comar CSB200 Class B AIS
Transponder. Missing from the image below are a CNS VDL6000 w/ Blue
Force and 2 SR162 receivers that are out in the field. We purchased
three different Class B devices to get more experience with
different devices.

As my co-author Brian pointed out, these units don't really operatate as transponders very often. They probably should be refered to as transcievers. If you ask Dictionary.com about transponder:
As my co-author Brian pointed out, these units don't really operatate as transponders very often. They probably should be refered to as transcievers. If you ask Dictionary.com about transponder:
transponder
a radio, radar, or sonar transceiver that automatically transmits a
signal upon reception of a designated incoming signal.

Origin:
1940-45; trans(mitter) + (res)ponder
So only in the case when the unit is being interogated, does these devices work as a transponder.
04.14.2009 17:47
AIS Traffic Analysis paper finished
Yesterday, Brian Calder and I
finished our paper for the US Hydro conference in May:
Traffic Analysis for the Calibration of Risk Assessment Methods [PDF]
Traffic Analysis for the Calibration of Risk Assessment Methods [PDF]
In order to provide some measure of the uncertainty inherent in
the sorts of charting data that are provided to the end-user, we have
previously proposed risk models that measure the magnitude of the
uncertainty for a ship operating in a particular area. Calibration of
these models is essential, but the complexity of the models means that
we require detailed information on the sorts of ships, traffic
patterns and density within the model area to make a reliable
assessment. In theory, the ais system should provide this information
for a suitably instrumented area. We consider the problem of
converting, filtering and analysing the raw ais traffic to provide
statistical characterizations of the traffic in a particular area, and
illustrate the method with data from 2008-10-01 through 2008-11-30
around Norfolk, VA. We show that it is possible to automatically
construct aggregate statistical characteristics of the port, resulting
in distributions of transit location, termina- tion and duration by
vessel category, as well as type of traffic, physical dimensions, and
intensity of activity.  We also observe that although 60 days give us
sufficient data for our immediate purposes, a large proportion of
it--up to 52% by message volume--must be considered dubious due to
difficulties in configuration, maintenance and operation of ais
transceivers.
04.14.2009 13:45
Anne Gilman's PhD Defense
Update 15-Apr-2009: Anne
successfully defended her PhD. Congrats!
Anne has been a member of the Vislab for a while now. Tomorrow, she will be defending here PhD at 9 AM in the Admiral's Conference room at CCOM! Here is a draft of her abstract:
KEEPING VISUAL-AUDITORY ASSOCIATIONS IN MIND: MEASURING THE IMPACT OF DETAIL AND MEANINGFULNESS ON CROSSMODAL WORKING MEMORY CAPACITY
Complex objects have been found to take up more visual working
memory-as measured by lowered change-detection accuracy with such
stimuli-than simple colored shapes (Treisman, 2006; Xu, 2002). While
this result is consistent with verbal working memory findings showing
reduced apparent capacity with longer words (Baddeley, 2007), other
research has demonstrated that features contributing to object
recognizability can help visual working memory capacity (Olsson &
Poom, 2005; Alvarez & Cavanagh, 2004). Furthermore, until very
recently, no measures of crossmodal working memory capacity had been
proposed, when crossmodal associations are part of the fabric of
learning, from classical conditioning to calculus. The working memory
load of a range of complex crossmodal objects was further examined in
a sequence of experiments adapting classic visual change detection
procedures (Vogel et al., 2001) to measure crossmodal
(visual-auditory) working memory capacity. The adapted method involves
rapid sequential presentation of image-sound pairs, with a test pair
appearing after a 1-second delay. Images are placed equidistant from
each other in the initial array, approximately 3.5! from the center of
the screen. A series of experiments using this new measure evaluated
the working memory impact of two sources of complexity: featural
detail and object meaningfulness. Changing the location of the test
pair-as opposed to presenting it in its original position-resulted in
lower changedetection performance. More surprising was an interaction
of test-probe location with the xii role of different image types
(gray and colored shapes, drawings, and photos), where image type
showed no consistent pattern of influence on WM capacity when test
objects appeared in their original locations; when shown in an
alternate location, more-complex images showed higher recall when
associated with the same set of sounds. Independent of test-probe
location, more-complex animal sounds provided better crossmodal change
detection performance than abstract tones. An association measure was
applied to both abstract and representational images, showing
consistently higher numbers of associations for the latter, and a
higher response bias for the more-meaningful images. This
meaningfulness characteristic did not covary with demonstrated working
memory capacity. Clear WM advantages were demonstrated in the
centered-test condition for color images, both more and less
meaningful, compared to grayscale ones. These results demonstrate the
utility of the novel crossmodal working memory capacity measure while
raising questions about predictions of cognitive load based solely on
featural characteristics for both abstract and meaningful images.
04.12.2009 08:34
What the XBox and Netflix are missing - on demand news
Time to ditch your DVDs? Alternative delivery catches on for
movies, TV [Fosters]
We've already ditched Cable and Satellite TV. The main thing missing is decent news. Like CNN did to Cable many years ago, someone needs to build a decent on demand news system for Netflix and other streaming systems. I'd definitely pay a couple dollars a month for good streaming news video... especially if there were a way to pick a few categories of news. Why not build a news cast for me based on my preferences including amount of available time?
We've already ditched Cable and Satellite TV. The main thing missing is decent news. Like CNN did to Cable many years ago, someone needs to build a decent on demand news system for Netflix and other streaming systems. I'd definitely pay a couple dollars a month for good streaming news video... especially if there were a way to pick a few categories of news. Why not build a news cast for me based on my preferences including amount of available time?
04.11.2009 21:24
gnuplot with sqlite
When I'm trying to work fast, I often
revert to my old methods. I'm doing some plots of N-AIS station
data that I have in a database. Here I've split the Class A and
Class B data into two groups. I want to do a SQL query from the two
databases and plot the data. I could do this in a shell script, but
it is nicer to work in the emacs gnuplot mode. The "!" provides
access to the shell, so I can make a sqlite3 call to pull the
needed day. Too bad gnuplot can't directly use sqlite3.

#!/usr/bin/env gnuplot

!echo "" > a-r003669930.dat
!sqlite3 classa-3station.db3 'SELECT day_number, pos_total, pos_us, mmsi_total, mmsi_us FROM classa_summary WHERE station="r003669930";' | tr '|' ' ' >> a-r003669930.dat

!echo "" > b-r003669930.dat
!sqlite3          classb.db3 'SELECT day_number, pos_total, pos_us, mmsi_total, mmsi_us FROM classb_summary WHERE station="r003669930";' | tr '|' ' ' >> b-r003669930.dat

set xlabel 'Day number - 2008-01-01 to 2009-04-04'
set logscale y

set title 'MMSI/day for station r003669930 New York / CT?'
set ylabel 'Distinct MMSI / day'
plot 'a-r003669930.dat' using 1:4 with l title 'Class A Total', 'a-r003669930.dat' using 1:5 with p title 'Class A US' , \
     'b-r003669930.dat' using 1:4 with l title 'Class B Total', 'b-r003669930.dat' using 1:5 with p title 'Class B US'
04.10.2009 09:47
West Marine AIS-1000 Class B
I've just received two West Marine
AIS-1000 Class B transponders. I've got two other brands that
should be arriving in the next week or two, so hopefully, we will
have 4 vessels in the Portsmouth, NH area broadcasting their
positions.

The back side of the device:

The back side of the device:
04.09.2009 17:44
sqlite3 python - better way to pull a lookup table?
In python, is there a better way to
build a dictionary for a lookup table pulled from sqlite3? Yup!
It's a little weird, but this makes it a one liner (aside from the
imports and db setup):
import sqlite3

cx = sqlite3.connect('classb.db3')
cx.row_factory = sqlite3.Row

mmsi_prefixes = dict([tuple(row) for row in  cx.execute('SELECT code,country FROM mmsi_prefix;')])
The resulting dictionary:
{
  512: u'New Zealand',
  750: u'Guyana',
  514: u'Cambodia (Kingdom of)',
  515: u'Cambodia (Kingdom of)',
  516: u'Christmas Island (Indian Ocean)',
  ...
}
04.09.2009 15:00
USCG station codes
Just ran into a variation in the
USCG's station specification. In addition to the 'r' for receiver
and 'b' for basestation, I'm seeing 'R' for one receiver. Here is a
Class B NMEA string with the capital R.
% ./ais_msg_18.py -d '!AIVDM,1,1,,B,B8suM;kIope?cI0kgJIOuOqwb`=qlnNmnPWj,0*42,s21013,d-123,T03.02412746,x279,R11SMOR1,1236410221'
positionb:
        MessageID:          18
        RepeatIndicator:    0
        UserID:             599743791
        Reserved1:          0
        SOG:                47.9
        PositionAccuracy:   1
        longitude:          39.53565666666666666666666667
        latitude:           5.651476666666666666666666667
        COG:                153.5
        TrueHeading:        191
        TimeStamp:          51
        RegionalReserved:   0
        Spare:              0
        RAIM:               False
        CommStateSelector:  1
        CommState:          164729
Which appears to be in Africa... inland Ethiopia. I'm sure this is
just noise.04.09.2009 07:08
network uptime derived from data logging
I just tried out the idea of using my
N-AIS feed to check network uptime and it worked much better than I
though it would. For each day, I counted the unique seconds in the
data timestamps and divided by the number of seconds in a day. This
is not the best way to measure the uptime, but it is interesting.
The main causes of outages are:

Overall uptime for the entire datalogging system as seen by CCOM:
Note that this is not a good way to judge any one component of the system. The timestamps are being added regionally by the uscg and I have no way of separating out the failure modes from just the timestamped NMEA strings.
Contrast that with one of our field data loggers running Ubuntu 7.10.
NOTE: I found that my script didn't notice entire days with no data. For 2008-06-{13,14}, there was nothing, so my % uptime is over estimated.
- Power outages to our building (we are on the wrong site of the train tracks)
- Loss of network connectivity at CCOM or UNH
- Loss of the network between Groton, CT and UNH
- Three hangs of my Mac desktop that is logging before I upgraded to 10.5
- One outage of 1 hour as I upgraded to mac osx 10.5
Overall uptime for the entire datalogging system as seen by CCOM:
seconds = [int(d.split()[1]) for d in file('sec-per-day.dat')]
len(seconds)
Out: 458  # Days
sum(seconds) / (len(seconds)*24*60*60.)
Out: 0.97799285844250361
The overall system was not working for 10 days worth of time during
those 458 days.Note that this is not a good way to judge any one component of the system. The timestamps are being added regionally by the uscg and I have no way of separating out the failure modes from just the timestamped NMEA strings.
Contrast that with one of our field data loggers running Ubuntu 7.10.
% uptime
 06:58:57 up 408 days, 17:31,  1 user,  load average: 0.00, 0.07, 0.23
The field machine is at Adams Point in Jackson lab and has a small UPS that has made it through all the local power hickups. Plus the machine logs locally with periodic dumps back to ccom. Too bad the sensors attached to it are not as reliable.
NOTE: I found that my script didn't notice entire days with no data. For 2008-06-{13,14}, there was nothing, so my % uptime is over estimated.
04.08.2009 15:24
Chart of the Future at the US Hydro meeting
Come join us on Friday right after
the Hydro conference at the last workshop.
U.S. Hydro 2009 Workshops
U.S. Hydro 2009 Workshops
Chart of the Future: Nautical Charts and Hydrography in an
E-Navigation World in the Monticello Room

There is a clear and compelling need to equip shipboard users and
those ashore responsible for the safety and efficiency of shipping
with modern, proven information tools. These tools must be optimized
for good decision making in order to make maritime navigation and
communications more reliable and user friendly. The overall goal is to
improve safety and efficiency of navigation and to reduce errors.

This "Chart of the Future" workshop, organized as a roundtable
discussion, will provide attendees an opportunity to identify
requirements, problems, and opportunities for the next generation of
electronic charts and the modern source data from which they are
built. The results will be used by NOAA and other hydrographic
offices, developers, and regulators to guide the evolution and
deployment of an advanced marine information infrastructure.

Particular attention will be given to requirements, problems, and
opportunities associated with the International Maritime
Organization's E-Navigation initiative. E-navigation is intended to
meet present and future user needs through harmonization of marine
navigation systems and supporting shore services. Further,
E-Navigation is intended to avoid a lack of standardization on board
and ashore, incompatibility between vessels, and to avoid increased
complexity.

For further information contact Dave.enabnit@noaa.gov
04.07.2009 21:48
Need help with compiling scipy 0.7.0 on fink
Update: Sebastien Maret found the
problem over in numpy (called scipy-core-py in fink): Trac ticket 1087 for
numpy - Unsupported -arch flag on Darwin. Should now work in
fink thanks to Sebastien patching it.
If anyone know how to fix this compile error with scipy 0.7.0 on Mac OSX 10.5.5 intel? This builds on PPC. Where do I find this -arch i686 thing and get rid of it?
SciPy Dev Trac entry 915
If anyone know how to fix this compile error with scipy 0.7.0 on Mac OSX 10.5.5 intel? This builds on PPC. Where do I find this -arch i686 thing and get rid of it?
SciPy Dev Trac entry 915
gcc version 4.4.0 20090327 (prerelease) (GCC)
Using built-in specs.
Target: i686-apple-darwin9
Configured with: ../gcc-4.4-20090327/configure --prefix=/sw \
  --prefix=/sw/lib/gcc4.4 --mandir=/sw/share/man --infodir=/sw/share/info \
  --enable-languages=c,c++,fortran,objc,java --with-gmp=/sw \
  --with-libiconv-prefix=/sw --with-ppl=/sw --with-cloog=/sw \
  --with-system-zlib --x-includes=/usr/X11R6/include \
  --x-libraries=/usr/X11R6/lib --disable-libjava-multilib --with-arch=nocona \
  --with-tune=generic --build=i686-apple-darwin9 --host=i686-apple-darwin9 \
  --target=i686-apple-darwin9
Thread model: posix
gcc version 4.4.0 20090327 (prerelease) (GCC)
customize Gnu95FCompiler using build_clib
building 'dfftpack' library
compiling Fortran sources
Fortran f77 compiler: /sw/bin/gfortran -Wall -ffixed-form -fno-second-underscore \
-arch i686 -fPIC -O3 -funroll-loops
Fortran f90 compiler: /sw/bin/gfortran -Wall -fno-second-underscore -arch i686 \
-fPIC -O3 -funroll-loops
Fortran fix compiler: /sw/bin/gfortran -Wall -ffixed-form -fno-second-underscore \
-Wall -fno-second-underscore -arch i686 -fPIC -O3 -funroll-loops
creating build/temp.macosx-10.5-i386-2.5
creating build/temp.macosx-10.5-i386-2.5/scipy
creating build/temp.macosx-10.5-i386-2.5/scipy/fftpack
creating build/temp.macosx-10.5-i386-2.5/scipy/fftpack/src
creating build/temp.macosx-10.5-i386-2.5/scipy/fftpack/src/dfftpack
compile options: '-I/sw/lib/python2.5/site-packages/numpy/core/include -c'
gfortran:f77: scipy/fftpack/src/dfftpack/dcosqb.f
f951: error: unrecognized command line option "-arch"
f951: error: unrecognized command line option "-arch"
error: Command "/sw/bin/gfortran -Wall -ffixed-form -fno-second-underscore -arch \
i686 -fPIC -O3 -funroll-loops -I/sw/lib/python2.5/site-packages/numpy/core/include \
-c -c scipy/fftpack/src/dfftpack/dcosqb.f -o \
build/temp.macosx-10.5-i386-2.5/scipy/fftpack/src/dfftpack/dcosqb.o" failed with exit status 1
04.07.2009 10:47
Windows Time Service - is it running?
Here is how you check to see if
windows time service is running on Windows XP. Thanks to Will F.
for showing me this.
Start -> Control Pannels -> Administrative Tools -> Services -> Extended tab.
As it says:

Start -> Control Pannels -> Administrative Tools -> Services -> Extended tab.
As it says:
Services (Local)

Windows Time

Description:
Maintains date and tie synchronization
on all clients and servers in the network.
If this service is stopped, date and time
synchronization will be unavailable.  If this
servece is disabled, any services that
explicitly depend on it will fail to start.
My recommendation is to install NTP and avoid Windows Time Service.
04.05.2009 14:32
Reading a Bathymetry Attributed Grid (BAG) with python
Turns out, it is just easier to go
read a bag on my own with python. I just added h5py to fink.
#!/usr/bin/env python

import h5py

f = h5py.File('sample.bag')

print f.listobjects()
print f.listitems()

bag_root = f['/BAG_root']
metadata = ''.join(bag_root['metadata'])

print metadata[0:200]

elevation = bag_root['elevation']

print elevation.shape

data = elevation.value
print type(data)
print data
The results of the above code:
[('BAG_root', <HDF5 group "BAG_root" (4 members)>)]

<?xml version="1.0" encoding="UTF-8" standalone="no" ?><!-- \
Sample Bathymetric Attribute Grid Meta data - Created by the Open \
Naviation Surface Working Group.  Based on ISO19139 schema v1.0 --><smXML:

(10, 10)

<type 'numpy.ndarray'>

[[ 10.          10.10000038  10.19999981  10.30000019  10.39999962  10.5
   10.60000038  10.69999981  10.80000019  10.89999962]
 [ 11.          11.10000038  11.19999981  11.30000019  11.39999962  11.5
   11.60000038  11.69999981  11.80000019  11.89999962]
 [ 12.          12.10000038  12.19999981  12.30000019  12.39999962  12.5
   12.60000038  12.69999981  12.80000019  12.89999962]
 [ 13.          13.10000038  13.19999981  13.30000019  13.39999962  13.5
   13.60000038  13.69999981  13.80000019  13.89999962]
 [ 14.          14.10000038  14.19999981  14.30000019  14.39999962  14.5
   14.60000038  14.69999981  14.80000019  14.89999962]
 [ 15.          15.10000038  15.19999981  15.30000019  15.39999962  15.5
   15.60000038  15.69999981  15.80000019  15.89999962]
 [ 16.          16.10000038  16.20000076  16.29999924  16.39999962  16.5
   16.60000038  16.70000076  16.79999924  16.89999962]
 [ 17.          17.10000038  17.20000076  17.29999924  17.39999962  17.5
   17.60000038  17.70000076  17.79999924  17.89999962]
 [ 18.          18.10000038  18.20000076  18.29999924  18.39999962  18.5
   18.60000038  18.70000076  18.79999924  18.89999962]
 [ 19.          19.10000038  19.20000076  19.29999924  19.39999962  19.5
   19.60000038  19.70000076  19.79999924  19.89999962]]
04.05.2009 10:22
OpenNS with GeoTrans
I just got Open Navigation Surface (OpenNS)
to compile with NGA's GeoTrans 2.4.2. OpenNS comes with an
unversioned geotrans tar, the since then, NGA has changed the API
for the Lambert projections. Of course, I tried the included
bagread to see if what I had done worked on mac osx with the
geograns.info
and openns fink packages, and I got this error:
% bin/bagread sample-data/sample.bag
Input BAG file: sample-data/sample.bag
trying to open: {sample-data/sample.bag}...
bag file unavailable ! 400
I haven't had time to dig into the code to explore what that error
means. Here is the diff to OpenNS:
% diff -ur OpenNS_CandidateRelease_1.1.0{,-new}
Giving...
diff -ur OpenNS_CandidateRelease_1.1.0/api/bag_geotrans.c OpenNS_CandidateRelease_1.1.0-new/api/bag_geotrans.c
--- OpenNS_CandidateRelease_1.1.0/api/bag_geotrans.c      2006-04-28 15:55:50.000000000 -0400
+++ OpenNS_CandidateRelease_1.1.0-new/api/bag_geotrans.c  2009-04-04 21:29:12.000000000 -0400
@@ -159,7 +159,7 @@
     Transverse_Mercator_Parameters tranmerc;   /* transverse mercator */
     UTM_Parameters utm;                                /* universal transverse mercator */
     Polar_Stereo_Parameters polarst;           /* polar stereographic */
-    Lambert_Conformal_Conic_Parameters lambert;  /* lambert conformal conic */
+    Lambert_Conformal_Conic_2_Parameters lambert;        /* lambert conformal conic */
 } GeotransParameters;

 /* union of all the coordinate tuples defined in engine.h needed for bag */
@@ -171,7 +171,7 @@
     UTM_Tuple utm;                             /* universal transverse mercator */
     Polar_Stereo_Tuple polarst;                        /* polar stereographic */
     UPS_Tuple ups;                             /* universal polar stereographic */
-    Lambert_Conformal_Conic_Tuple lambert;       /* lambert conformal conic */
+    Lambert_Conformal_Conic_2_Tuple lambert;     /* lambert conformal conic */
 } GeotransTuple;

 /* these data are used global within this file */
@@ -340,7 +340,7 @@
        {
                case Input:
                {
-                 inParams.mercator.origin_latitude = params->origin_latitude*DEG2RAD;
+                 inParams.mercator.latitude_of_true_scale = params->origin_latitude*DEG2RAD;
                        inParams.mercator.central_meridian = params->central_meridian*DEG2RAD;
                        inParams.mercator.scale_factor = params->scale_factor;
                        inParams.mercator.false_easting = params->false_easting;
@@ -351,7 +351,7 @@
                break;
                case Output:
                {
-                 outParams.mercator.origin_latitude = params->origin_latitude*DEG2RAD;
+                 outParams.mercator.latitude_of_true_scale = params->origin_latitude*DEG2RAD;
                        outParams.mercator.central_meridian = params->central_meridian*DEG2RAD;
                        outParams.mercator.scale_factor = params->scale_factor;
                        outParams.mercator.false_easting = params->false_easting;
@@ -670,8 +670,8 @@
                        inParams.lambert.std_parallel_2 = params->std_parallel_2*DEG2RAD;
                        inParams.lambert.false_easting = params->false_easting;
                        inParams.lambert.false_northing = params->false_northing;
-                 stat |= Set_Coordinate_System( Interactive, Input, Lambert_Conformal_Conic );
-                 stat |= Set_Lambert_Conformal_Conic_Params( Interactive, Input, inParams.lambert );
+                 stat |= Set_Coordinate_System( Interactive, Input, Lambert_Conformal_Conic_2 );
+                 stat |= Set_Lambert_Conformal_Conic_2_Params( Interactive, Input, inParams.lambert );
                }
                break;
                case Output:
@@ -682,8 +682,8 @@
                        outParams.lambert.std_parallel_2 = params->std_parallel_2*DEG2RAD;
                        outParams.lambert.false_easting = params->false_easting;
                        outParams.lambert.false_northing = params->false_northing;
-                 stat |= Set_Coordinate_System( Interactive, Output, Lambert_Conformal_Conic );
-                 stat |= Set_Lambert_Conformal_Conic_Params( Interactive, Output, outParams.lambert );
+                 stat |= Set_Coordinate_System( Interactive, Output, Lambert_Conformal_Conic_2 );
+                 stat |= Set_Lambert_Conformal_Conic_2_Params( Interactive, Output, outParams.lambert );
                }
                break;
                default:
@@ -741,7 +741,7 @@
                        stat |= init_ups( Input, input_params );
                }
                break;
-         case Lambert_Conformal_Conic:
+         case Lambert_Conformal_Conic_2:
                {
                        stat |= init_lambert( Input, input_params );
                }
@@ -802,7 +802,7 @@
                        stat |= init_ups( Output, output_params );
                }
                break;
-         case Lambert_Conformal_Conic:
+         case Lambert_Conformal_Conic_2:
                {
                        stat |= init_lambert( Output, output_params );
                }
@@ -870,11 +870,11 @@
                        Set_UPS_Coordinates( Interactive, Input, inTuple.ups );
                }
                break;
-         case Lambert_Conformal_Conic:
+         case Lambert_Conformal_Conic_2:
                {
                        inTuple.lambert.easting = input_coords->easting;
                        inTuple.lambert.northing = input_coords->northing;
-                 Set_Lambert_Conformal_Conic_Coordinates( Interactive, Input, inTuple.lambert );
+                 Set_Lambert_Conformal_Conic_2_Coordinates( Interactive, Input, inTuple.lambert );
                }
                break;
                default:
@@ -942,9 +942,9 @@
                        output_coords->hemisphere = outTuple.ups.hemisphere;
                }
                break;
-         case Lambert_Conformal_Conic:
+         case Lambert_Conformal_Conic_2:
                {
-                 stat |= Get_Lambert_Conformal_Conic_Coordinates( Interactive, Output, &outTuple.lambert );
+                 stat |= Get_Lambert_Conformal_Conic_2_Coordinates( Interactive, Output, &outTuple.lambert );
                        output_coords->easting = outTuple.lambert.easting;
                        output_coords->northing = outTuple.lambert.northing;
                }
diff -ur OpenNS_CandidateRelease_1.1.0/api/dt_cc.h OpenNS_CandidateRelease_1.1.0-new/api/dt_cc.h
--- OpenNS_CandidateRelease_1.1.0/api/dt_cc.h     2006-02-20 17:07:03.000000000 -0500
+++ OpenNS_CandidateRelease_1.1.0-new/api/dt_cc.h 2009-04-04 17:41:05.000000000 -0400
@@ -18,7 +18,7 @@
 #include <mgrs/mgrs.h>
 #include <mercator/mercator.h>
 #include <loccart/loccart.h>
-#include <lambert/lambert.h>
+#include <lambert_2/lambert_2.h>
 #include <grinten/grinten.h>
 #include <gnomonic/gnomonic.h>
 #include <georef/georef.h>
diff -ur OpenNS_CandidateRelease_1.1.0/api/libincludes.pro OpenNS_CandidateRelease_1.1.0-new/api/libincludes.pro
--- OpenNS_CandidateRelease_1.1.0/api/libincludes.pro     2006-03-13 15:48:06.000000000 -0500
+++ OpenNS_CandidateRelease_1.1.0-new/api/libincludes.pro 2009-04-04 21:30:26.000000000 -0400
@@ -1,5 +1,5 @@
-XERCESCROOT = $(PWD)/../extlibs/xerces-c-src_2_6_0
+#XERCESCROOT = $(PWD)/../extlibs/xerces-c-src_2_6_0

 # Setup the OpenNS software development includes. Normally application projects
 # will just need to include INC_OPENNSALL.
-INC_OPENNSALL   = ../api ../extlibs/hdf5-1.6.1/src ../extlibs/geotrans ../extlibs/beecrypt-4.1.2 ../extlibs $(XERCESCROOT)/src
+#INC_OPENNSALL   = ../api ../extlibs/hdf5-1.6.1/src ../extlibs/geotrans ../extlibs/beecrypt-4.1.2 ../extlibs $(XERCESCROOT)/src
diff -ur OpenNS_CandidateRelease_1.1.0/api/libmaster.pro OpenNS_CandidateRelease_1.1.0-new/api/libmaster.pro
--- OpenNS_CandidateRelease_1.1.0/api/libmaster.pro       2006-07-13 10:33:47.000000000 -0400
+++ OpenNS_CandidateRelease_1.1.0-new/api/libmaster.pro   2009-04-04 21:21:49.000000000 -0400
@@ -51,7 +51,7 @@
        OBJECTS_DIR = .obj/$(HOSTMACHINE)
        QMAKE_CFLAGS += ${IVSCOPTS}
        QMAKE_CXXFLAGS += ${IVSCCOPTS2}
- OPENNSLIBS += -lhdf5 -lxerces-c -lgeotrans -lbeecrypt -lszip -lzlib -lpthread
+ OPENNSLIBS += -lhdf5 -lxerces-c -lgeotrans -lbeecrypt -lsz -lz -lpthread
        LIBS    += $$SYSOBJFILES $$OPENNSLIBS $$EXTRAUNIXLIBS
         DESTDIR = ../lib/$(HOSTMACHINE)/
     macx {
04.04.2009 17:01
Guidelines to releasing open source code
What works for commercial software
does not work in the open source world. In the open source world,
you need to "play nice." Here are some quick items that I keep
running into. I'm not saying that you have to live 100% by the
GNU
Coding Standards, but software that is written with those
concepts in mind is much easier to port and package.
- Name your package carefully. It's best if your name makes sense as all one stream of letters and numbers. e.g. [a-z][a-z0-9]+
- Don't restrict your downloads and force a user to submit an email and/or click that they accept the license on a web page. If curl or wget won't work, I don't want to use the software.
- Provide a tar of your source in the form of name-version.tar.bz2. Something about zips makes things go wrong way to often.
- NEVER EVER re-release a tar with the same name with different content. If the MD5 sum chances, up the minor minor version number (N.N.N+1). Hey, it's free! Even if it was just a couple hours ago, change the number. One tar filename - one md5 sum.
- Compress your tar with "bzip2 -9" to save the worlds mirrors disk space and reduce network traffic
- Your tar should unpack to name-version
- In your main release, do not include other packages. It's fine if you make some separate bloated beast of an archive, but don't make me download it.
- Do NOT put compiled binaries in the archive. Java coders... don't just give me a jar full of compiled class files.
- Use a nice build system. If you have properly used gnu autoconf for C or C++ projects (or setuptools/pip for python), I might actually be able to build your code.
- Add some unit tests so I know that what I've built works with the libraries on the computer that I've got.
- Include a history or change log. Make sure to note big changes in dependencies.
- Include a README file. Make sure to clearly specify the software's license.
- Use a sane and common license... one of GPL, LGPL, MIT/BSD, or straight Public Domain. Don't try to write your own. You won't understand it and neither will eye.
- If you are producing a shared library, please try to number your .so/dylib sanely and make libtool number it right. package-1.0 and package-2.0 should have different library major numbers. The major number should change when your libary is binary incompatible. It's okay if package-3.0 has a libary.
- Use the latest version of libtool. Learn "otool -L" if you are a mac developer
- Mac Developers... not everybody wants to use Frameworks.
- Try to give your command line programs names that don't class with other packages. And if you let me specify a prefix to commands, all the better.
- Man pages are good. Provide them and let me control where they get installed.
- Give me a place to submit bugs and patches. Don't make me subscribe to your mailing list. Give me a way to reset a password for your site without contacting you by email (Dear OGC... hint hint)
- If you are writing C or C++, try to use a modern version of the language. K&R C is just not a good thing. Turn on the compiler warnings and fix most of them.
- Build your code on at least two architectures.
- UNIX != only Solaris. To many of us, UNIX is a superset of Cygwin, Linuxes, Solaris, HPUX, Dariwin (Mac OSX), and more.
- Provide examples with text describing them. If they are big, put them in a separate archive (same goes for the test data).
- Provide read only access to your revision control repository (git,svn,mercurial, etc), but don't stop making point releases. Packaging from a moving target is scary.
- Stop using CVS. SVN (among others) is so much better. It will make your code better to switch away from that crusty old beast.
- ... there's more but back to real work for me ...
04.04.2009 08:07
Python Sqlite3 Row factory
Python's sqlite3 module can
access rows by name rather than index... no fancy ORM needed.
It does require using Python 2.6. Python 2.5 intruduced the sqlite3
interface module, but it does not have the field/column by name
feature. Here is getting started. The key is to enable the "Row
Factory"


ipython
import sqlite3
import numpy as np # For arrays

cx = sqlite3.connect('transits.db3')
cx.row_factory = sqlite3.Row  # Enable the row factory
sqlite3 also has a feature that we don't need to create a database
cursor. Grab one row from the database:
row = cx.execute('SELECT * FROM raw_transits LIMIT 1;').fetchone()

print row # Get the row the normal way

print row.keys() # Get the column/field names

print 'Direct access',row['key'],row['UserID']
This prints out:
(1, 205493000, 72, 1226580085, 1226597127, 0.5, 0.20000000000000001, 300.0, 600.0, 0)
['key', 'UserID', 'shipandcargo', 'start_time', 'end_time', 'active_sog', 'static_sog', 'static_time', 'max_timeg
ap', 'dubious']
Direct access 1 205493000
Since we have the column/field names, we can loop over all the fields or use the new python string templating "format" function. It helps that a row can now be turned into a dict, but by asking it to become a dict.
for key in row.keys():
    print key, row[key]

print dict(row)

print '''A row...
key:            {0[key]}
MMSI:           {0[UserID]}
Ship and Cargo: {0[shipandcargo]}
'''.format(dict(row))
The results...
UserID 205493000
shipandcargo 72
start_time 1226580085
end_time 1226597127
active_sog 0.5
static_sog 0.2
static_time 300.0
max_timegap 600.0
dubious 0

{'shipandcargo': 72, 'static_sog': 0.20000000000000001, 'start_time': 1226580085, 'UserID': 205493000, 'static_ti
me': 300.0, 'dubious': 0, 'end_time': 1226597127, 'key': 1, 'max_timegap': 600.0, 'active_sog': 0.5}

A row...
key:            1
MMSI:           205493000
Ship and Cargo: 72
We can now also do a list comprehension to convert a fetched
list of a column. The numpy array allows for more effient storage
of a list where every element is the same.
mmsi = np.array([row['UserID'] for row in cx.execute('SELECT UserID from raw_transits;')])
# Avoid as many replacements by using AS
active_sog = np.array([row['data'] for row in cx.execute('SELECT active_sog AS data from raw_transits;')])

#
# Pull in the whole database into memory
#
keys = cx.execute('SELECT * FROM raw_transits LIMIT 1;').fetchone().keys()

data = {}
for key in keys:
    data[key] = np.array([row['data'] for row in cx.execute('SELECT %s AS data from raw_transits;' % (key,))])

print 'MMSI Array:',len(mmsi),type(mmsi)
This results in mmsi being an array:
MMSI Array: 15785 <type 'numpy.ndarray'>Now that we have a dictionary call data we can start plotting up the data. If you want to do this interactively, pylab will help (ipython -pylab):
import pylab

pylab.plot(data['shipandcargo'])
pylab.savefig('shipandcargo.gif')
pylab.show()
However, if you want to plot straight to a file and prevent a GUI
from popping up, do this:
import matplotlib
matplotlib.use('Agg')
import matplotlib.pyplot as plt

fig = plt.figure()
ax = fig.add_subplot(111)
ax.plot(data['shipandcargo'])
ax.set_title('Ship and Cargo')
fig.savefig('shipandcargo.png')
fig2 = plt.figure()
ax = fig2.add_subplot(111)
ax.plot(data['UserID'],data['shipandcargo'], 'o')
ax.set_xlabel('Vessel MMSI')
ax.set_ylabel('Ship and Cargo number')
ax.set_title('Ship and Cargo')
fig2.savefig('ship-shipandcargo.png')
04.02.2009 19:48
Whiteboard to figures
Today was practice with trying to
create clean figures will Illustrator. I am fairly happy with these
results of going from my whiteboard scrawl to figures.


It took me a lot of tries with the mouse to make the storm front...

Just don't count on the above codes until the document is submitted.
It took me a lot of tries with the mouse to make the storm front...
Just don't count on the above codes until the document is submitted.
04.01.2009 16:28
Book your trip to Mars on Expedia
Jim Garnder passed along this link to
me today...
Flight to Mars - Complete Mars Vacation Guide - Expedia Space
Happy April 1st!

Flight to Mars - Complete Mars Vacation Guide - Expedia Space
Happy April 1st!